The cartography, GIS, and geospatial blog

A hand drawing a map

Do We Still Need Maps? Cartography in the 21st Century

I’m a cartographer. Yes, that means I make maps. To many, this comes as a surprise. Common responses include “Do we still need new maps?” or “Don’t we already have all the maps?” You get used to it, but I doubt many other professions find their relevance questioned so regularly. The confusion likely stems from a lack of insight into how the proverbial sausage is made. In the popular imagination, cartographers are synonymous with explorers, mapping new lands yet undiscovered1....
Jack Stephan
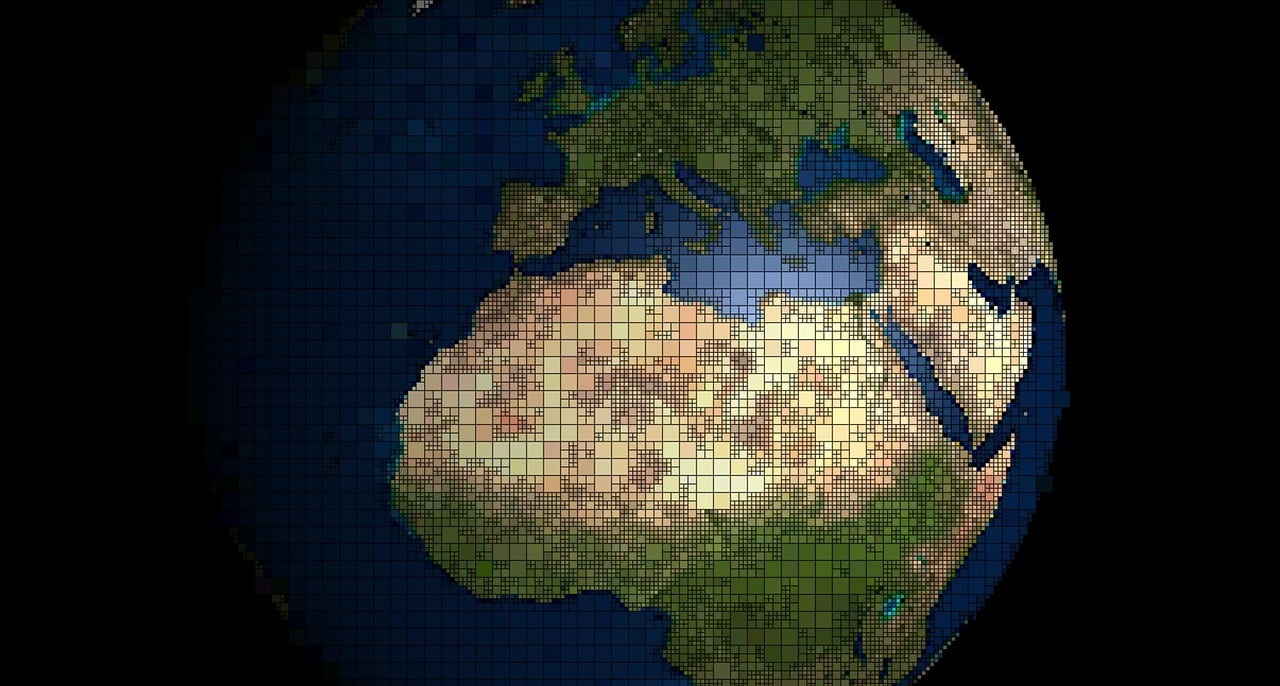
Globe with Squares on it

Geospatial Data Explained

What is Geospatial Data? Geospatial data, or Geodata, is any data that contains a spatial dimension i.e. it’s data that has a where. Examples of geodata include demographics, street networks, administrative boundaries, vehicle locations, and much, much more. Additionally, geospatial data commonly has attribute data associated with it such as names, descriptions, and classifications. It is also common for these features to include temporal information such as dates and time periods....

Jack Stephan
Example of a Kepler map

Getting Started with Kepler: A Beginner's Tutorial

What is Kepler.gl? Kepler.gl, or just Kepler, is an open-source browser-based mapping visualization tool built on top of deck.gl, an open-source WebGL framework designed to visualize large-scale geospatial datasets. Kepler offers extensive capabilities for mapping geospatial data without the need to download any software or send data to another server. All the magic happens at home, on your machine. In this tutorial, we’ll look at how to make a few different types of visualizations using a data set already provided by Kepler....

Jack Stephan